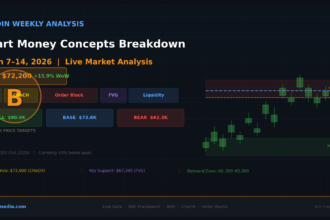


Bitcoin walked into July 2026 carrying some serious scar tissue. After starting the year above $93,000 and touching an all-time high near $126,000 back in October 2025, BTC spent the first half of this year giving almost all of that back. June alone wiped out close to 20% of its value, closing out the month somewhere in the high $50,000s to low $60,000s — one of Bitcoin’s worst monthly performances on record.
So the question everyone’s typing into Google right now is simple: does July bring the bounce, or is this the start of something worse? Let’s go through what’s actually driving the price, what the levels look like, and what different analysts are saying — without pretending anyone has a crystal ball.
Where Bitcoin Stands Right Now
As of early July 2026, Bitcoin is trading somewhere in the $59,000–$62,000 range, depending on the exact hour and exchange you check. That puts it well below its 50-month and 20-month moving averages, both of which are still pointing down — a sign that the medium-term trend remains bearish even if short-term bounces happen along the way.
A few things stand out in the current setup:
- Leverage has been flushed out. Bitcoin’s open interest (basically, the total value of active futures bets) has dropped sharply from around $90 billion at its peak to somewhere between $21 billion and $46 billion depending on the source. Less leverage in the system generally means less risk of the kind of violent liquidation cascade that turns a dip into a crash.
- Whales are quietly buying. On-chain data shows large holders scooping up hundreds of thousands of BTC over the past few weeks, which usually signals accumulation rather than panic.
- ETF outflows are the real drag. US spot Bitcoin ETFs saw roughly $4 billion leave in June alone — reportedly the largest monthly redemption since these products launched. That’s arguably done more damage to price than anything happening inside the crypto market itself.
The Key Levels Everyone’s Watching
If you strip away the noise, most of July’s price action comes down to a handful of support and resistance zones:
On the downside: The $58,000 region is the line in the sand. Lose that, and $55,000–$56,000 comes into view. Below that, some technical setups (a head-and-shoulders pattern some chartists are tracking) point toward a deeper move into the low $50,000s or even high $40,000s if selling accelerates.
On the upside: Bitcoin needs to reclaim its 20-day EMA, sitting around $62,000–$64,000, before anyone can talk seriously about a trend reversal. Clear that, and the next resistance band sits around $66,000–$68,000. A stronger breakout could stretch toward $70,000–$73,000, though most analysts frame that as the optimistic scenario rather than the base case.
Three Scenarios for July
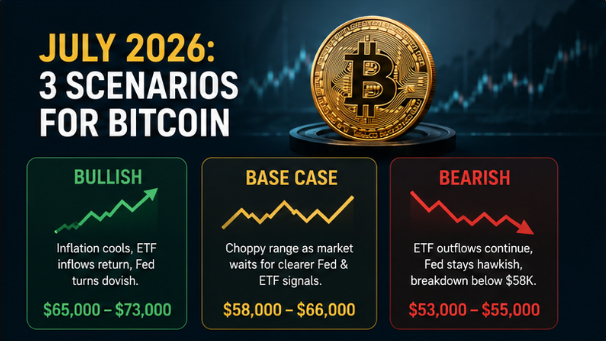
Bullish case: Inflation data cools in mid-July, ETF outflows reverse into inflows, and the Federal Reserve signals a softer tone at its July 28–29 meeting. In this scenario, BTC holds above $60,000, flips it into support, and pushes toward the mid-$60,000s to low $70,000s by month’s end.
Base case (the one most analysts lean toward): A slow, choppy grind rather than a sharp move in either direction. Bitcoin oscillates in the $58,000–$66,000 range while the market waits for clearer signals from the Fed and from ETF flow data. This is the “wait and see” month.
Bearish case: ETF outflows continue, the Fed stays hawkish, and Bitcoin fails to hold $58,000. That opens the door to a deeper slide toward $53,000–$55,000, with $42,000 floated by some technical analysts as a worst-case downside target if the breakdown accelerates.
What Wall Street Is Saying
The forecasts on the Street have gotten noticeably less unified than earlier in the year. Bernstein has held onto a $150,000 year-end target, arguing Bitcoin has likely already found its bottom. Citi went the other direction, cutting its 12-month target down to $82,000 from $112,000, pointing to ETF outflows, soft investor demand, and slow progress on US crypto regulation as reasons for caution. Citi’s more bearish scenario puts BTC as low as $53,000.
That split matters. It tells you this isn’t a market where “everyone agrees Bitcoin goes up” anymore — the debate is genuinely open, and both sides have real arguments behind them.
Why July Historically Matters
There’s a seasonal pattern worth knowing: looking back from 2013 through 2025, Bitcoin has closed July in the green in 9 out of 13 years, with an average monthly return north of 7%. That gives July a reputation as one of Bitcoin’s stronger recovery months, especially after a rough June — which is exactly the setup this year.
But seasonality is a tendency, not a rule. 2026 is fighting some headwinds that didn’t exist in most of those prior years: record ETF outflows, a Fed that’s stayed cautious longer than expected, and stalled progress on comprehensive US crypto legislation. History leans bullish for July. This year’s specific conditions complicate that lean.
The Two Catalysts That Actually Matter
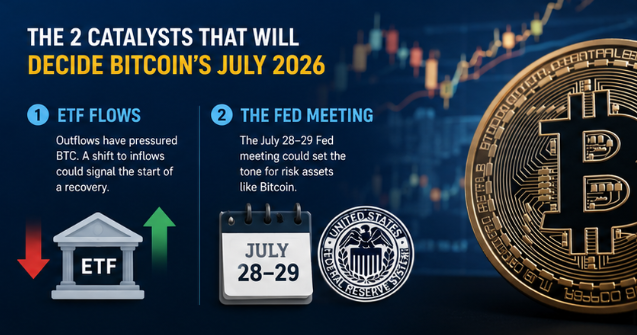
Strip away the noise and there are really only two things that will decide Bitcoin’s direction this month:
- ETF flow data. If institutional money starts flowing back into spot Bitcoin ETFs instead of out, that’s usually the first real sign that a bottom is forming. Until that reverses, rallies tend to run into selling pressure.
- The Fed’s July 28–29 meeting. A softer tone from the Fed on interest rates tends to push investors back toward risk assets like Bitcoin. A hawkish surprise does the opposite. Given how sensitive Bitcoin has been to macro policy all year, this single meeting could end up being the deciding factor for how July closes out.
So, Will Bitcoin Go Up in July 2026?
The honest answer: it’s leaning toward a slow grind rather than a clean bounce, with the direction likely decided by the Fed and ETF flows rather than anything crypto-specific. History favors a recovery month. Current conditions — outflows, macro caution, thin leverage — suggest that recovery, if it comes, is more likely to be gradual than explosive.
None of this is a guarantee in either direction. Bitcoin has a well-earned reputation for making both bulls and bears look wrong within the same month. If you’re holding or considering a position, the smarter move is tracking the actual data points above — ETF flows, the $58K–$64K range, and the Fed decision — rather than betting on any single prediction, including the ones in this article.
Frequently Asked Questions
Will Bitcoin reach $100,000 in July 2026?
Unlikely based on current data. Most analysts see that as a 2026 possibility only if July’s rebound turns into a confirmed, sustained trend reversal, not a base-case outcome for this month alone.
What is Bitcoin’s most important support level right now?
The $58,000 zone is the level most widely watched. A sustained break below it increases the odds of a deeper slide toward $53,000–$55,000.
What could push Bitcoin higher this month?
Cooler inflation data, a reversal in spot Bitcoin ETF outflows, and a softer tone from the Federal Reserve at its July 28–29 meeting are the three catalysts analysts are watching most closely.
This article is for informational purposes only and reflects publicly available market analysis as of early July 2026. It is not financial advice. Cryptocurrency markets are highly volatile — do your own research and consult a licensed financial advisor before making investment decisions.