Ethereum price prediction for March 2026 with technical analysis, liquidity zones, key support and resistance levels, and ETH targets of $2300 or $1700.Ethereum has entered one of the most interesting market phases of 2026. After a strong rally earlier this year, the second-largest cryptocurrency is now trading around $1950–$2000, creating uncertainty among traders and investors.
Many crypto traders are asking the same question:
Is Ethereum preparing for another rally toward $2300 — or will it drop toward $1700 before the next bull run?
To answer this question, we need to analyze several factors:
- Ethereum technical structure
- Liquidity zones targeted by institutions
- Smart money psychology
- Key support and resistance levels
- Potential trade setups for the week
In this detailed Ethereum market analysis, we will break everything down in simple language, so both beginners and experienced traders can understand where ETH might move next.
Ethereum Market Overview
Before diving deeper into technical analysis, let’s first understand the current Ethereum market position.
| Metric | Value |
|---|---|
| Current ETH Price | ~$1980 |
| Short-Term Trend | Bearish / Consolidation |
| Key Resistance | $2000 – $2100 |
| Key Support | $1950 – $1880 |
| Major Liquidity Zone | $1840 |
| Bullish Target | $2300 |
| Bearish Target | $1700 |
At the moment, Ethereum is trapped in a consolidation range, which usually indicates that the market is preparing for a larger directional move.
Professional traders often call this phase market compression.
And historically, compression leads to expansion.
Understanding Ethereum’s Recent Price Action
Over the past few weeks, Ethereum experienced a strong upward move toward the $2180 level. However, instead of continuing higher, the market suddenly reversed.
This rejection created what traders call:
Market Structure Shift (MSS).
Here’s what happened step-by-step:
- Ethereum rallied strongly toward $2180
- Buyers expected a breakout toward $2300
- Instead, the market reversed sharply
- Price began forming lower highs and lower lows
This change in structure indicates that short-term market control has shifted toward sellers.
However, this does not necessarily mean Ethereum will crash.
Instead, the market may simply be collecting liquidity before the next move.
Why Liquidity Matters in Crypto Markets
One of the most important concepts in modern trading is liquidity.
Large institutions — also known as smart money — often push prices toward areas where many traders have placed stop losses.
These areas contain liquidity pools.
When liquidity is triggered, institutions can execute large orders without moving the market too aggressively.
This is why crypto markets often appear to:
- Break support
- Reverse quickly
- Trigger stop losses
- Then move in the opposite direction
This process is known as liquidity hunting.
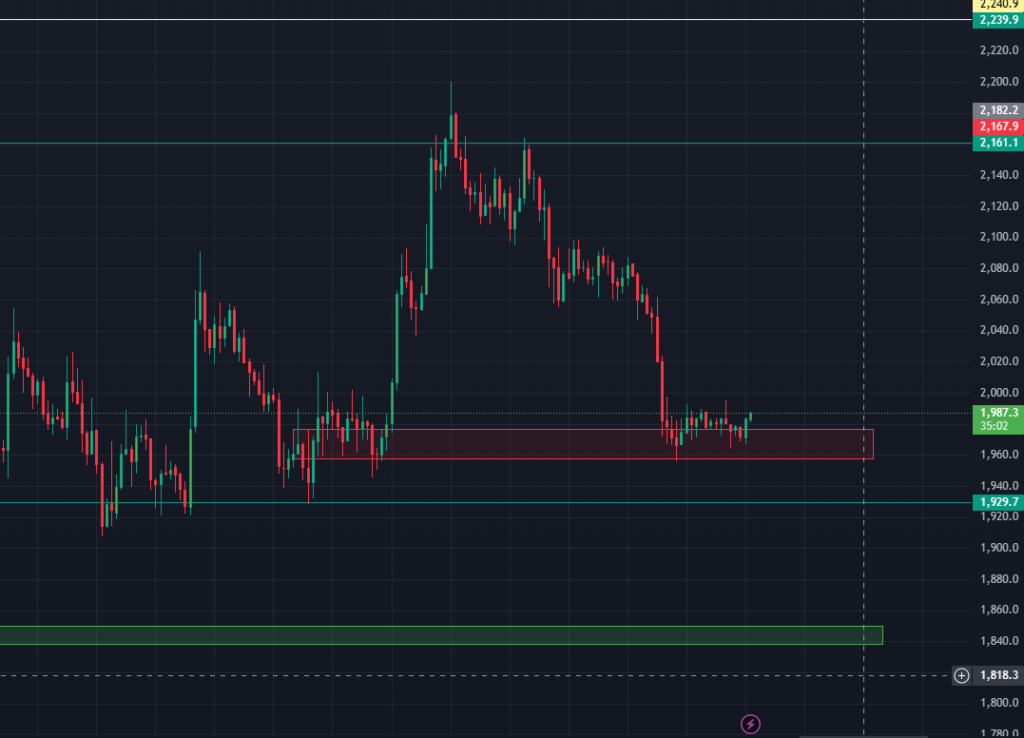
Major Ethereum Liquidity Zones
Below are the most important liquidity areas currently visible on the Ethereum chart.
Liquidity Below Current Price
| Level | Importance |
|---|---|
| $1950 | Equal lows liquidity |
| $1920 | Previous swing low |
| $1880 | Strong liquidity cluster |
| $1840 | Major demand zone |
If Ethereum begins moving downward, these levels could act as magnets for price.
Liquidity Above Current Price
| Level | Importance |
|---|---|
| $2050 | Local highs |
| $2100 | Psychological resistance |
| $2180 | Major liquidity pool |
If ETH breaks above these levels, it could trigger a short squeeze and push the price higher quickly.
Smart Money Psychology: How Big Players Move the Market
Most retail traders believe markets move randomly.
But professional traders know that markets usually follow three main phases.
Phase 1: Accumulation
Smart money quietly builds positions while price moves sideways.
Retail traders often lose interest during this stage.
Phase 2: Manipulation
Price briefly moves in the opposite direction of the real trend.
This phase triggers:
- Stop losses
- Panic selling
- Emotional trading
Phase 3: Expansion
After liquidity has been collected, the real trend begins.
This phase is where the biggest profits occur.
Right now, Ethereum appears to be entering the manipulation phase.
This means we may see fake breakouts or sudden spikes before the next major move begins.
Ethereum Price Prediction for March 2026
Let’s explore the two most realistic scenarios for Ethereum in the coming weeks.
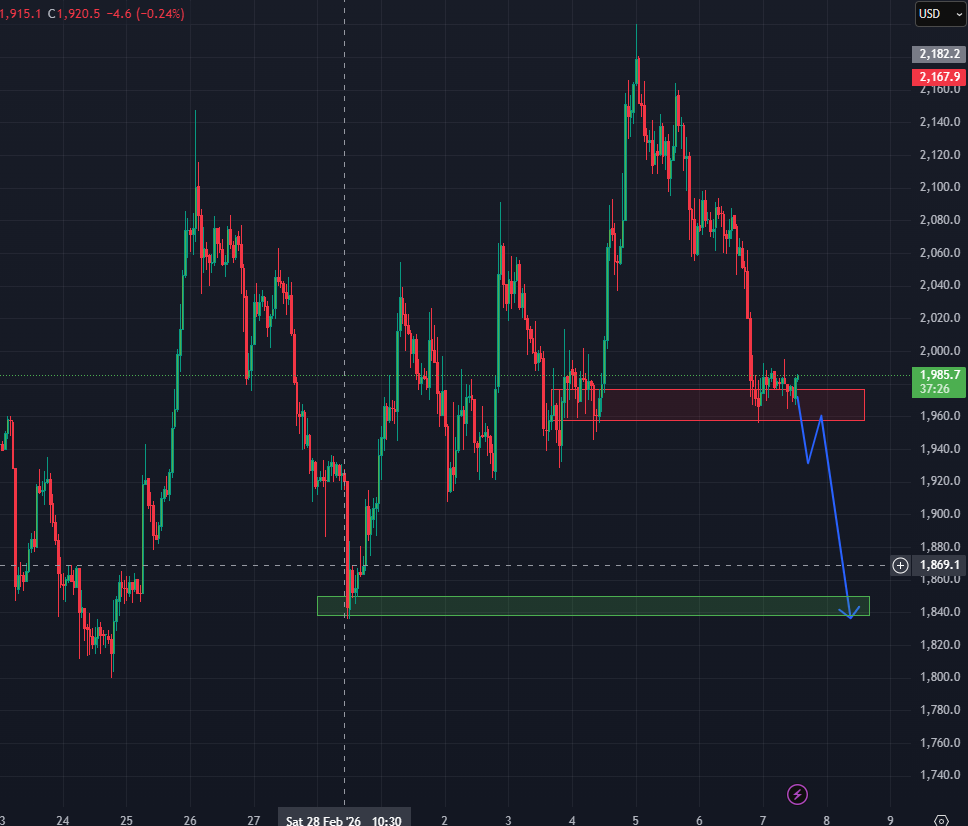
Scenario 1: Bearish Liquidity Sweep
If Ethereum breaks below the $1950 support, the market may attempt to collect liquidity from lower levels.
Possible price path:
1980
↓
1950
↓
1920
↓
1880
↓
1840
The $1840–$1860 zone is a strong demand area where buyers may re-enter the market.
If that happens, Ethereum could start a new upward move afterward.
Scenario 2: Bullish Breakout
If Ethereum successfully reclaims the $2000 level, buyers could regain control.
Possible bullish path:
1980
↑
2000
↑
2050
↑
2100
↑
2180
If ETH breaks above $2180, momentum could push the market toward $2300.
High Probability Ethereum Trade Setups
Below are three trading setups many professional traders may watch this week.
Trade Setup 1: Short Near Resistance
| Entry Zone | Stop Loss | Targets |
|---|---|---|
| $2000 – $2020 | $2055 | $1950 / $1920 |
This trade idea assumes Ethereum will reject resistance and move lower.
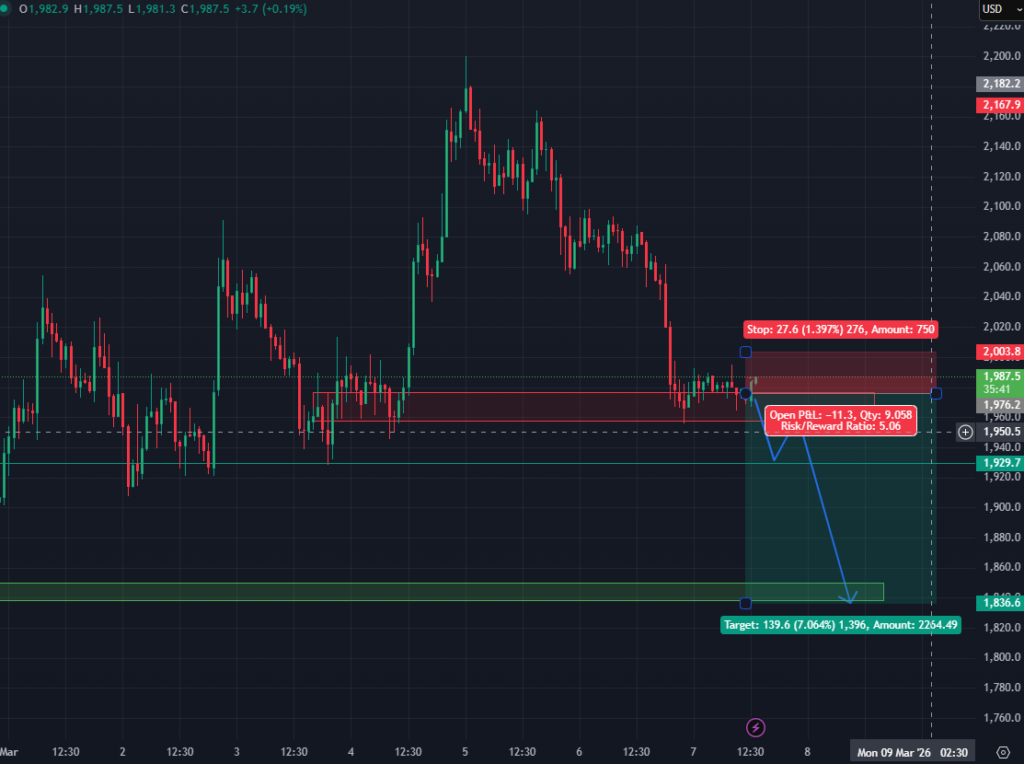
Trade Setup 2: Breakdown Trade
| Entry | Stop | Targets |
|---|---|---|
| $1945 | $1985 | $1900 / $1880 / $1840 |
If ETH breaks $1950, the market could accelerate downward.
Trade Setup 3: Reversal Long
| Entry | Stop | Targets |
|---|---|---|
| $1910 – $1920 | $1875 | $1980 / $2050 |
This setup looks for a liquidity sweep followed by a strong recovery.
Key Signals Traders Should Watch
Before entering any trade, it is important to look for confirmation signals.
These include:
✔ High trading volume
✔ Strong rejection candles
✔ Market structure shift on lower timeframes
✔ Retest of support or resistance levels
Without confirmation, entering trades can be risky.
Ethereum’s Mid-Term Outlook
Looking beyond short-term fluctuations, Ethereum remains one of the most important assets in the crypto market.
Several factors could influence its price in the coming months.
Institutional Adoption
Ethereum continues to attract institutional interest, especially after the rise of spot crypto ETFs.
Network Upgrades
Ethereum’s ongoing upgrades and improvements to scalability could increase demand for the network.
Bitcoin Influence
Historically, Ethereum tends to follow Bitcoin’s overall trend.
If Bitcoin moves higher, ETH often outperforms during bullish cycles.
Long-Term Ethereum Price Targets
While short-term price action can be unpredictable, many analysts believe Ethereum still has strong long-term potential.
Possible future targets include:
| Timeframe | Potential ETH Price |
|---|---|
| Short Term | $2100 – $2300 |
| Mid Term | $2600 – $3000 |
| Long Term | $4000+ |
Of course, crypto markets remain volatile, and traders should always manage risk carefully.
Final Thoughts
Ethereum is currently trading in a tight range between $1950 and $2000, suggesting that the market is building pressure before its next major move.
If the market breaks downward, ETH may sweep liquidity near $1920 or $1880.
However, if buyers reclaim the $2000 level, Ethereum could attempt another rally toward $2100 and $2300.
For traders and investors, the key is to watch liquidity levels and wait for confirmation before entering positions.
The next breakout from this range could determine Ethereum’s direction for the rest of March.
What is the Ethereum price prediction for March 2026?
Ethereum is currently trading near the $1950–$2000 range. If the market breaks above $2000 with strong momentum, ETH could move toward $2100 and possibly $2300. However, if support at $1950 breaks, the price may drop toward $1920, $1880, or even $1700.
Can Ethereum reach $2300 in 2026?
Yes, Ethereum can potentially reach $2300 if it breaks above key resistance levels near $2100 and $2180. A strong bullish momentum combined with increased market demand could push ETH toward the $2300 target.
Why is Ethereum price moving sideways?
Ethereum is currently in a consolidation phase between $1950 and $2000. This usually happens when the market is collecting liquidity before making a larger move either upward or downward.
What are the most important support and resistance levels for ETH?
The most important Ethereum support levels are $1950, $1920, $1880, and $1840. Key resistance levels include $2000, $2050, $2100, and $2180.
Is Ethereum a good investment in 2026?
Many analysts believe Ethereum remains one of the strongest cryptocurrencies due to its smart contract ecosystem, DeFi adoption, and ongoing network upgrades. However, crypto markets are volatile, so investors should always manage risk carefully.