Live Market Update · Smart Money Concepts Breakdown · Next Week Price Forecast
- The Weekly Chart: 5 Red Candles and a Big Bounce
- The 4-Hour Chart: Where the Real Action Is
- Your Level-by-Level Trading Map for Next Week
- 3 Scenarios for Next Week — Pick Your Path
- The Bigger Picture: What Is Really Driving Bitcoin Right Now
- What to Watch This Week — Your Checklist
- Verdict: Decision Zone — Be Patient
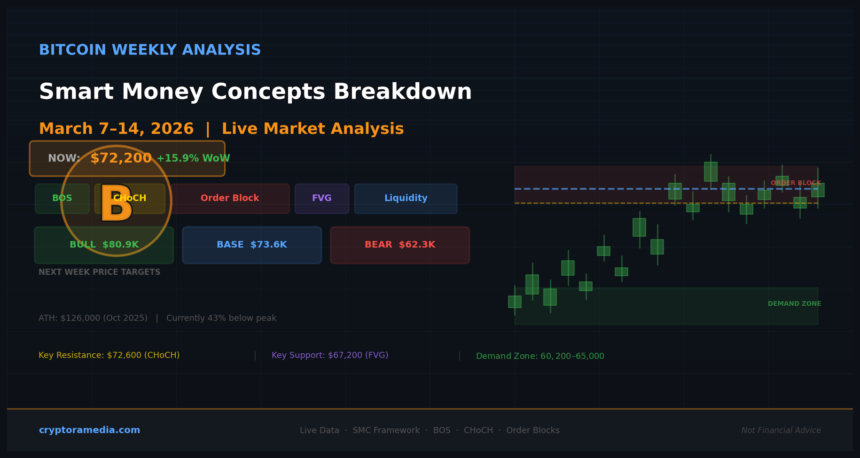
| Bitcoin Live Snapshot — March 7, 2026 Price RIGHT NOW: $72,200 Weekly High: $74,500 Weekly Low: $62,300 Market Cap: ~$1.43 Trillion 24H Volume: ~$44 Billion Weekly Performance: +15.9% (big bounce from demand zone) | Monthly: -8.5% RSI (Daily): 55.73 — Neutral zone | 4H MACD: Bullish crossover confirmed Fear & Greed Index: 22 — Extreme Fear (but recovering fast) KEY RESISTANCE: $72,600 (Bearish OB + CHoCH level) — the make-or-break zone KEY SUPPORT: $67,200 (FVG zone) then $62,300 (weekly demand) Bitcoin ATH: $126,000 (October 2025) — currently 43% below all-time high CoinCodex Next Week Target: $73,615 (base) / $80,904 (bull case) by March 14 |
Let’s be real. Bitcoin has had a rough few months. Five red candles in a row from the $126K all-time high in October 2025. A brutal 51% crash to $62,300 in February. Ouch.
But here’s what’s interesting — BTC just bounced 19% in two weeks from that $62,300 low. And today, March 7, it’s sitting at $72,200 — right at the most important resistance level on the chart. This week’s move could define where Bitcoin goes for the next month.
We’re going to break this down using Smart Money Concepts (SMC) — the framework used by institutional traders to read market structure. No guesswork. Just the key zones, what the 4H chart is telling us, and the exact scenarios to watch next week.
| SMC Quick Glossary — Read This First BOS (Break of Structure): Price breaks above a prior swing high (bullish) or below a prior swing low (bearish). Tells you who is winning — bulls or bears. CHoCH (Change of Character): A BOS that REVERSES the current trend. In a downtrend, a bullish CHoCH = first sign bulls are taking over. BIG signal. Order Block (OB): The last bearish candle before a big rally (bullish OB) OR the last bullish candle before a big drop (bearish OB). Smart money places orders here. FVG (Fair Value Gap): A price gap between 3 candles. Price moved so fast it left an “imbalance.” Markets love to come back and fill these gaps. Liquidity / EQH / EQL: Equal Highs (EQH) or Equal Lows (EQL) = clusters of stop-losses. Smart money hunts this liquidity before making the real move. |
The Weekly Chart: 5 Red Candles and a Big Bounce
Chart 1: BTC Weekly SMC Structure — Demand Zone, Order Blocks & Bearish BOS (Nov 2025 – Mar 7, 2026) | Cryptora Media
The weekly chart tells a clear story. Five consecutive bearish BOS (Break of Structure) from the $126K ATH. Every week, price broke below the previous week’s low. That is the definition of a bearish trend in SMC.
Then February 6 happened. BTC crashed to $62,300 — right into a massive Demand Zone, an area where buyers had stepped in strongly back in mid-2025. When price hit that zone again, it held. And the bounce was violent: $62,300 to $74,500 in under two weeks, a 19% move.
Here’s the honest part though: one bounce does NOT confirm a reversal. For the weekly trend to flip bullish in SMC terms, Bitcoin needs to close a weekly candle above the $72,200–$72,600 CHoCH zone (the last swing high before the drop). Until then, we’re still technically in a downtrend.
| Weekly Structure Summary Trend: Bearish (5 consecutive bearish BOS from Oct 2025 ATH) Current Bounce: +19% from $62,300 Demand Zone — healthy but not confirmed reversal yet Weekly CHoCH Level: $72,200–$72,600 — a sustained weekly close ABOVE here = trend flip to bullish Bearish OB / Supply: $79,000–$85,000 — heavy resistance zone if $72.6K breaks Bullish OB / Demand: $60,200–$65,000 — still intact; losing this on weekly close is the bear case |
The 4-Hour Chart: Where the Real Action Is
Chart 2: BTC 4-Hour SMC — BOS, CHoCH, Order Blocks, FVG and Liquidity Zones (Feb 21–Mar 7, 2026) | Cryptora Media
Zoom into the 4-hour chart and the SMC structure becomes really clear. Here’s exactly what happened step by step:
Step 1 — Bullish OB at $62K–$64.6K (Feb 21–23): This is where the big institutions were buying. The strong bullish candles that launched the bounce originated here. This zone is now your primary support on the 4H.
Step 2 — BOS at $67,200 (Feb 26): First bullish Break of Structure on the 4H. Price broke above the previous swing high at $67,200. Signal: buyers taking control. Notice the FVG (Fair Value Gap) left between $67,200 and $69,100 — that’s an imbalance the market will likely return to fill at some point.
Step 3 — CHoCH at $72,500 (Mar 1): Price broke above the prior swing high at $72,500 on the 4H chart. This is a confirmed 4H Change of Character — the trend character on the 4H has shifted from bearish to bullish. This is when momentum traders started entering long positions.
Step 4 — Liquidity Hunt + Pullback (Mar 3–Mar 7): After sweeping Equal Highs (EQH) liquidity at $74,500, price pulled back to current $72,200. This is textbook SMC: smart money takes the liquidity above recent highs, then retraces to fill orders before the next push. The Bearish OB at $71,000–$73,000 is acting as overhead resistance right now.
Right now, BTC is sitting inside the Bearish OB zone. That means bulls need to push price through this zone convincingly — or we’ll see a rejection and pullback to the FVG.
Your Level-by-Level Trading Map for Next Week
| Level | Price | SMC Type | What It Means |
| CRITICAL RESIST | $72,600 | CHoCH + Bearish OB | Must break this with a daily close + volume to confirm bullish continuation. This is THE level of the week. |
| RESISTANCE | $74,500 | EQH Liquidity | Equal Highs where price already tapped this week. A sweep above here targets $79K–$80K. |
| RESISTANCE | $79,000–$80,000 | Bearish OB (Weekly) | Big weekly supply zone. Heavy selling expected here. CoinCodex bull target is $80,904. |
| SUPPORT | $67,200–$69,100 | FVG (4H) | Unfilled Fair Value Gap. Price often returns to fill this before continuing. Best long entry zone. |
| SUPPORT | $62,300 | Demand Zone (Weekly) | The big bounce origin. If this breaks on a daily close — bear case is active. |
| CRITICAL | $60,000 | Psychological + OB | Last line of defence. Losing this on a weekly close = potential drop toward $50K. |
Chart 3: BTC Next Week Scenarios (left) and Key SMC Level Map (right) — Mar 9–14, 2026 | Cryptora Media
3 Scenarios for Next Week — Pick Your Path
Scenario 1: Bullish (Probability: 35%)
Trigger: Daily close above $72,600 with strong volume.
What happens: The Bearish OB flips. Next stop $74,500 (sweep EQH liquidity), then $79,000–$80,904. CoinCodex targets $80,904 by March 14 in this scenario. This would confirm both the 4H CHoCH and begin challenging the weekly CHoCH zone.
SMC entry signal: Clean break + retest of $72,600 as support. If price breaks above, comes back to $72,600, and holds with a bullish rejection candle — that is your confirmation entry.
Scenario 2: Base Case / Range (Probability: 40%)
Trigger: BTC consolidates between $67,200 and $72,600.
What happens: Price dips into the FVG at $67,200–$69,100 to sweep liquidity and fill the imbalance, then bounces back up toward $72K. CoinCodex base case is $73,615 by March 14. Classic SMC accumulation pattern before continuation.
SMC entry signal: A dip to the FVG ($67.2K–$69.1K) with a strong rejection candle (bullish engulfing or hammer) is the cleanest risk:reward long setup of the week.
Scenario 3: Bearish (Probability: 25%)
Trigger: Rejection at $72,600 + daily close below $67,000.
What happens: Price returns to retest the $62,300 weekly demand zone. If $62,300 breaks on a sustained daily close, the next major support is $60,000. Macro headwinds (Trump tariffs, Iran tensions, equity weakness) could accelerate this.
SMC warning signal: A daily close below $67,000 with rising volume is the bear flag. Below that, the $62,300 retest is live.
The Bigger Picture: What Is Really Driving Bitcoin Right Now
Charts tell us structure. But markets don’t move on charts alone. Here is what the data underneath is saying:
| On-Chain and Macro Signals — March 7, 2026 BULLISH: Long-term holder selling collapsed from -243,700 BTC/month (Feb) to just -31,967 BTC (Mar 1). Selling is drying up fast. BULLISH: Miner capitulation cooling — daily BTC sold by miners dropped from 4,718 BTC to 837 BTC. Miners are stabilising. BULLISH: Macroeconomist Henrik Zeberg: “Bitcoin rallies to $110–120K in primary scenario, fueled by Risk-On Fever, ETF inflows, and continued institutional adoption.” BEARISH: ETF outflows: ~$7.8B out of spot Bitcoin ETFs since November 2025. Until ETF flows turn consistently positive, institutional headwind persists. BEARISH: BTC/S&P500 correlation: 0.55 (30-day rolling). Bitcoin is still trading like a risk asset. When stocks sell off, BTC follows. BEARISH: February returned -14.9% — fifth consecutive red month. Median March return is -1.31% historically. Seasonal pressure is real. WATCH: Gold just hit an all-time high of $5,280+. Capital is rotating to safe havens. When gold peaks and risk appetite returns, BTC historically benefits. |
The key tension this week: fundamentally, the sell pressure is easing. But ETF flows and macro correlation are still headwinds. The base case is that BTC chops in the $67K–$73K range while the market makes up its mind. Patient SMC traders wait for the FVG fill — that is where smart money has been placing orders in every recent pullback.
What to Watch This Week — Your Checklist
| Day | Event / Signal | Why It Matters |
| Monday Mar 9 | Weekend gap + opening price | Gap up above $72,600 = bullish pre-market signal. Gap down below $70K = caution. |
| Mon–Tue | 4H candle closes above $72,600 | If yes: bull case activates. Enter long on retest. Target $74,500 then $79K. |
| Tuesday Mar 10 | US tariff / macro news | Trump tariff escalation = risk-off = BTC weakness. Any tariff rollback = positive. |
| Wed Mar 11 | CPI inflation data (US) | Hot CPI = bad for BTC (risk-off). Cool CPI = potential catalyst for next leg up. |
| Daily watch | ETF flow data | 3 consecutive days of positive ETF inflows = institutional confidence returning = bullish. |
| Daily watch | Volume on any move | Low volume bounce to $72.6K = potential bull trap. High volume break = genuine signal. |
| Friday Mar 14 | Weekly close | Close above $72,600 = weekly CHoCH in progress. Close below $67K = bear alert. |
Verdict: Decision Zone — Be Patient
Bitcoin is sitting at its most important level of the month: the $72,200–$72,600 CHoCH resistance. This is the zone that separates the bounce-that-becomes-a-recovery from the bounce-that-fails-and-retests-$62K.
The smart money play here is patience. The cleanest entry this week is a pullback to the FVG at $67,200–$69,100, followed by a bullish rejection candle. That gives you defined risk (stop below $65,000), a clear invalidation level, and a 3:1 or better risk:reward toward $80,900.
Aggressive traders watch for the $72,600 break + retest on high volume. Patient traders wait for the FVG dip. Both are valid — but the FVG entry is lower risk.
Not financial advice. This is educational market analysis only. Always manage your own risk.