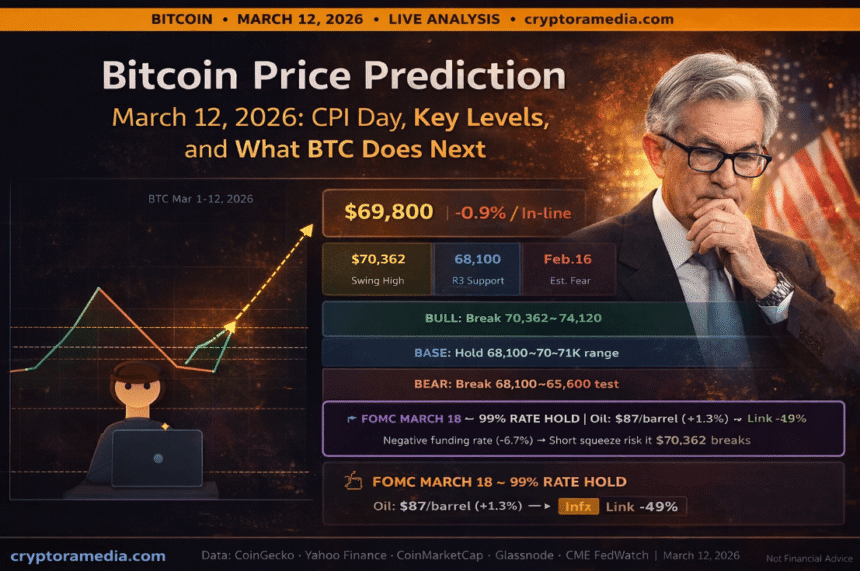
| Cryptora Media Bitcoin Price Prediction March 12, 2026 BTC is at $69,800 on March 12. CPI came in at 2.4% exactly as expected. No surprise, no rate cut, no major reaction. Bitcoin dipped briefly to $69,000 then recovered. Our call: The base case for today is a tight range between $68,100 and $70,562. The key trigger is whether BTC can close a daily candle above $70,562 the swing high from March 10. Until that happens, resistance is in control. The setup we like: Long from $68,100–$68,500 (50% Fibonacci) on a bullish 4H rejection candle. Target $70,562 first, then $74,120. Stop below $67,520. |
| Metric | Value | Metric | Value |
| Price (Mar 12, 10:00 UTC) | $69,800 | 24H Change | -0.9% |
| 24H Range | $68,800 – $70,760 | Volume | $34.2B |
| RSI (14) | 43.2 — Neutral | Fear & Greed | 15 — Extreme Fear |
| CPI (Feb 2026) | 2.4% YoY (in-line) | Core CPI | 2.5% YoY (in-line) |
| FOMC (Mar 18) | 99% rate hold | WTI Oil | $87/barrel |
| OI Change (24H) | +13.8% | Liquidations (24H) | -49% to $79.4M |
Bitcoin price prediction March 12, 2026: the CPI number everyone was watching just dropped — and it was boring. Headline inflation held at 2.4%, core at 2.5%, both matching forecasts exactly. Bitcoin dipped below $69,000 for exactly 12 minutes, then recovered to $69,800. That is the CPI reaction: a non-event.
But the real story isn’t today. The FOMC meeting on March 18 is six days away. The $70,562 swing high is the wall between a bounce that goes nowhere and one that actually matters. And a negative funding rate of -0.78% means every short in the market is potential fuel for a squeeze. Here is the full picture.
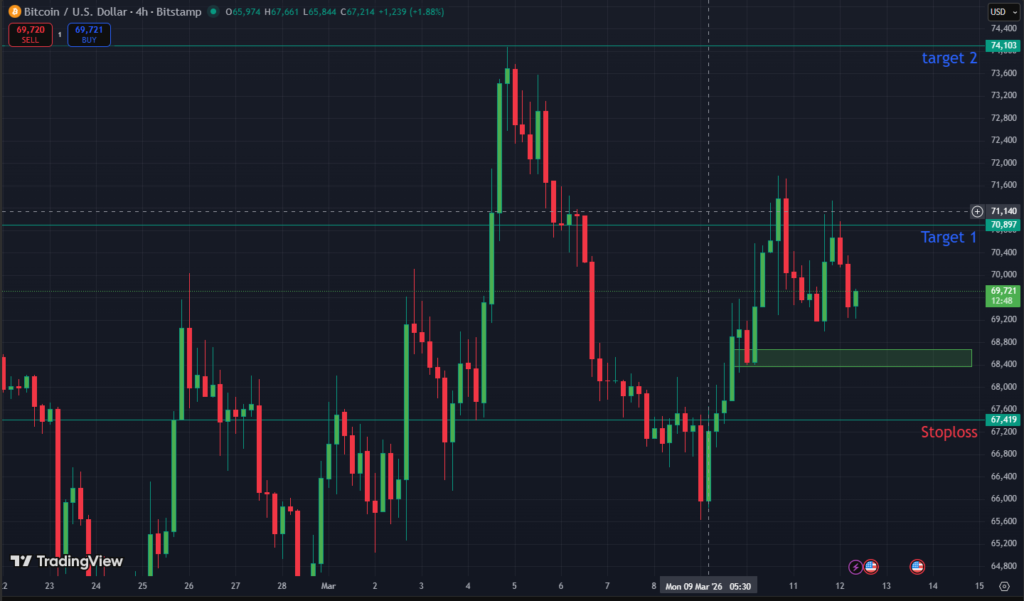
Bitcoin daily chart March 12, 2026 — swing high resistance at $70,562, Fibonacci support at $68,100, forward scenario paths | Cryptora Media
Bitcoin Technical Analysis — March 12, 2026
Here is our read on the chart. Bitcoin broke above the 23.6% Fibonacci retracement at $69,400 on March 11 — that was the first clean structural signal we had since the war low. The break confirmed that the $63,000 low from February 28 was a capitulation wick, not a trend continuation.
The structure now is simple: $70,562 is the swing high from March 10. That is the resistance that matters. Below it, price is ranging. Above it, the next Fibonacci target is $74,120, and if that breaks, $79,194 becomes the target. On the downside, the 50% retracement at $68,100 must hold. Lose that on a 4H close and $67,520 becomes the next test. Below $67,520 on volume — the head-and-shoulders neckline at $65,600 comes back into play.
Key Bitcoin Support and Resistance Levels — March 12
| Level | Price | Structure | Our Read |
| RESISTANCE 2 | $74,120 | Fibonacci cluster (38.2%) | Bull case target. Only relevant after $70,562 breaks on volume. |
| RESISTANCE 1 | $70,562 | March 10 swing high | THE wall today. Daily close above = structure shifts bullish. |
| 23.6% FIB | $69,400 | Broken resistance → now support | BTC needs to hold above here. Loss = momentum fades. |
| CURRENT PRICE | $69,800 | Live price (Mar 12, 10:00 UTC) | Caught between two levels. Range-bound until one breaks. |
| 50% FIB SUPPORT | $68,100 | Key Fibonacci + previous range high | Our long entry zone. Loss on 4H close = bearish shift. |
| SUPPORT 2 | $67,520 | Previous range low | Second line of defence. Break here tests $65,600 next. |
| CRITICAL FLOOR | $65,600 | H&S neckline (pattern still active) | Daily close below = bear case engaged. Target $59,500. |
What the On-Chain and Derivatives Data Is Saying
Three data points stand out today. All three point in the same direction: caution with a bullish lean.
| Liquidations dropped 49% to $79.4M in 24 hours — the market flushed out weak hands. That is cleaner structure going forward. |
| Open Interest rose 13.8% simultaneously — traders are rebuilding positions cautiously, not aggressively. This supports a slow, sustainable move rather than a rip. |
| Funding rate is negative at -0.78% — the market is leaning short. If BTC closes above $70,562, those shorts are forced to cover. That is the short squeeze trigger. |
The CPI reaction confirms our read: this market is not ready to make a directional move until the FOMC on March 18. The 2.4% CPI print was priced in. There was no rate cut signal and no surprise. Bitcoin responded exactly as it should — a 12-minute dip followed by recovery. The market is waiting.
CPI 2.4% and FOMC March 18: What It Means for Bitcoin
| Data Point | Result | Rate Cut Impact | BTC Impact |
| Headline CPI (Feb) | 2.4% YoY (in-line) | No change to expectations | Neutral — sell-the-news dip absorbed quickly |
| Core CPI (Feb) | 2.5% YoY (in-line) | No change to expectations | Neutral — confirms no Fed pivot near-term |
| Monthly CPI | 0.3% MoM (in-line) | Slightly sticky — no cuts | Slightly bearish near-term |
| FOMC March 18 | 99% rate hold (CME FedWatch) | No March cut | Already priced in. Focus shifts to May/June language. |
| April rate cut odds | 11% (down from 21%) | Rate cut pushed further out | Moderate bearish pressure on risk assets |
| WTI Oil | $87/barrel (Iran war) | Re-inflation risk rising | Keeps May/June cut probability low |
The bottom line on CPI: the number was fine but not good enough to move the needle on rate cuts. April cut odds fell to 11%. The next real catalyst for Bitcoin is the FOMC statement on March 18 — specifically the dot plot language around May and June. A single sentence hinting at mid-year cuts would be the most bullish macro signal BTC has had since the ETF approvals.
Bitcoin Price Prediction March 12–17: Our 3 Scenarios
| BULL CASE – $74,120 (Probability: 30%) Trigger: 4H close above $70,562 with volume above 30-day average. Path: Short squeeze ignites as negative funding rate (-0.78%) forces covers. $70,562 → $72,000 → $74,120. Confirmation: Daily close above $70,562 + Nasdaq holding green + Oil below $84. Our signal to act: Buy $70,600 breakout retest with stop at $69,800. Target $74,120 (R:R 1:5.7). |
| BASE CASE — $68,100 to $70,562 Range (Probability: 50%) Trigger: No decisive catalyst before FOMC March 18. Market waits. Path: BTC consolidates between 50% Fib ($68,100) and swing high ($70,562). Range trades at 2-3% width. Confirmation: Two or more daily closes inside the range + ETF flows flat. Our signal to act: Range trade — buy $68,100–$68,500, sell $70,300–$70,562. Tight stops. |
| BEAR CASE — $65,600 Test (Probability: 20%) Trigger: 4H close below $68,100 with volume. H&S pattern re-activates. Path: $68,100 fails → $67,520 → $65,600 neckline test. Measured move below $65,600 = $59,500. Confirmation: Daily close below $68,100 + Oil above $90 + Nasdaq red. Our signal to act: Short $67,900 on failed retest of $68,100. Stop $68,400. Target $65,600 (R:R 1:4.6). |
Our Preferred Trade Setup — March 12
| Setup | Entry | Stop Loss | Target 1 | Target 2 | R:R |
| LONG (Best R:R) | $68,100–$68,500 | $67,450 | $70,562 | $74,120 | 1:5.7 |
| BREAKOUT LONG | $70,600 (retest) | $69,800 | $72,000 | $74,120 | 1:4.5 |
| SHORT (if bear confirms) | $67,900 | $68,450 | $65,600 | $62,300 | 1:6.2 |
Not financial advice. All data as of March 12, 2026, 10:00 UTC from CoinDesk, Yahoo Finance, Glassnode and CME FedWatch.

Bitcoin Price Drivers: March 12–18, 2026
| Date | Event | BTC Impact |
| Mar 12 (today) | CPI released: 2.4% (in-line) | Neutral — absorbed. No rate cut signal. |
| Mar 12–14 | ETF daily flow data | 3 consecutive positive days = near-term bull signal. Watch BlackRock IBIT. |
| Mar 14 | Weekly BTC close | Close above $70,562 = bullish structure. Below $68,100 = caution. |
| Mar 15–17 | Iran war updates | Oil above $90 = bearish. De-escalation = bullish catalyst. |
| Mar 18 | FOMC rate decision + dot plot | 99% hold expected. The language on May/June cuts is what actually matters for BTC. |
Frequently Asked Questions
What is the Bitcoin price prediction for March 12, 2026?
Our Bitcoin price prediction for March 12, 2026: the base case is a tight range between $68,100 (50% Fibonacci support) and $70,562 (March 10 swing high resistance). Bitcoin is trading at $69,800 as of 10:00 UTC. CPI came in at 2.4% year-on-year — exactly in-line with forecasts — producing a non-event reaction. The next major catalyst is the FOMC meeting on March 18. Our preferred long entry is $68,100–$68,500 on a 4H bullish rejection candle, targeting $70,562 first and $74,120 second.
What is the Bitcoin price today, March 12, 2026?
Bitcoin price today on March 12, 2026 is $69,800 as of 10:00 UTC, according to Yahoo Finance and CoinDesk. The 24-hour range is $68,800 to $70,760. Bitcoin dipped briefly below $69,000 following the CPI release at 8:30 ET before recovering. The 24-hour change is -0.9%. Fear and Greed Index stands at 15 — Extreme Fear. Open interest rose 13.8% while liquidations dropped 49%, indicating a cleaner market structure than previous sessions.
How did CPI affect Bitcoin price on March 12, 2026?
The February 2026 CPI data released on March 12 showed headline inflation at 2.4% year-on-year and core CPI at 2.5% — both exactly in line with market forecasts. Bitcoin’s reaction was muted: a 12-minute dip below $69,000 followed by recovery to $69,800. The in-line reading reinforced expectations that the Federal Reserve will hold rates at the March 18 FOMC meeting, with April rate cut odds falling to 11%. The CPI was not a strong enough catalyst in either direction to break Bitcoin out of its current $68,100–$70,562 range.
What is Bitcoin support today, March 12, 2026?
Bitcoin’s key support levels on March 12, 2026 are: $68,100 (the 50% Fibonacci retracement from the March swing — most important), $67,520 (previous range low — second line of defence), and $65,600 (the head-and-shoulders neckline, still active as a pattern trigger). A 4-hour candle close below $68,100 on above-average volume would be our signal that the bear case has engaged, targeting $67,520 and then $65,600.
What happens to Bitcoin at the FOMC on March 18, 2026?
The FOMC meeting on March 18, 2026 is already priced in at 99% probability of a rate hold, according to CME FedWatch data. Bitcoin will not rally on the hold decision itself — it’s expected. What matters is the language in the Federal Reserve statement and dot plot around May and June 2026. If the Fed signals any openness to a mid-year cut, that would be a bullish catalyst for Bitcoin and risk assets broadly. If the statement remains hawkish — especially citing oil prices from the Iran war — April cut odds would fall further and near-term BTC headwinds would increase.
What is the Bitcoin resistance level on March 12, 2026?
The primary Bitcoin resistance level on March 12, 2026 is $70,562 — the swing high from March 10. This is the level that must break on a daily close with volume for the bull case to activate. Above $70,562, the next Fibonacci resistance is $74,120, followed by $79,194. Until Bitcoin produces a daily close above $70,562, resistance is in control and the range between $68,100 and $70,562 is the operating zone.
What is the short squeeze risk for Bitcoin on March 12, 2026?
Bitcoin’s funding rate is negative at -0.78% as of March 12, 2026 — a four-week low, according to Glassnode data. A negative funding rate means the market is leaning net short. If Bitcoin closes a 4H candle above $70,562 on above-average volume, short sellers would be forced to close positions (cover), adding buying pressure and potentially accelerating the move. This short squeeze mechanism is the most likely path to a rapid push toward $72,000 to $74,120 if the resistance breaks. Open interest rising 13.8% simultaneously confirms that new positions are being built — meaning the squeeze fuel is loading.