
| Direct Answer: Bitcoin Price Prediction March 10, 2026 Bitcoin is trading at $67,579 on March 10, 2026 — up 1.05% in 24 hours with volume surging 53% to $37.89B. The base case price prediction for today: consolidation between $65,600 (support) and $70,800 (resistance). A break above $70,800 targets $74,100. A break below $65,600 targets $59,500. |
| Metric | Value | Metric | Value |
| Price (Mar 10, 08:00 UTC) | $67,579 | 24H Change | +1.05% |
| 24H Range | $65,600 – $68,200 | 24H Volume | $37.89B (+53%) |
| Market Cap | $1.34 trillion | BTC Dominance | 56.1% |
| RSI (14-day) | 37.9 — Recovering | Fear & Greed Index | 15 — Extreme Fear |
| ATH | $126,210 (Oct 2025) | Drawdown from ATH | -46.5% |
| 200-day EMA | ~$67,641 | YTD 2026 | -30.8% |
Bitcoin price prediction March 10, 2026: BTC is at $67,579 as of 08:00 UTC, up 1.05% after US President Trump hinted at a joint decision with Israeli PM Netanyahu on the US-Iran conflict — the first meaningful de-escalation signal since the war began. According to CoinGecko, trading volume surged 53% to $37.89 billion, the strongest volume day in two weeks.
The BTC price today sits at a critical decision point. A head-and-shoulders pattern on the 4H chart has its neckline at $65,600. Glassnode data shows 400,000+ BTC were accumulated between $62,300 and $67,000 during February and March 2026 — creating structural demand. Here is the full breakdown.
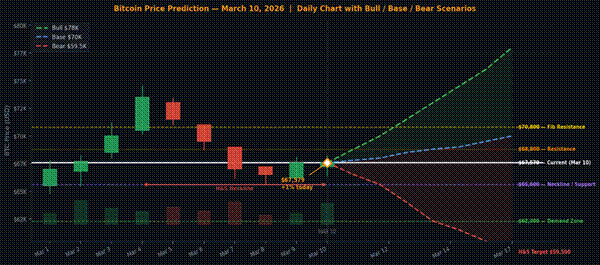
Bitcoin price prediction March 10, 2026 — daily chart with support at $65,600, resistance at $70,800 and three scenario paths | Cryptora Media
Bitcoin Technical Analysis March 10, 2026
According to analysis published March 10, a head-and-shoulders pattern on the 4H chart has a measured move target of $59,500 if the $65,600 neckline breaks on a confirmed 4H close. Bitcoin briefly broke below $65,600 on March 8 before immediately reclaiming the level — preventing a confirmed breakdown. The pattern remains active and must be watched.
The RSI sits at 37.9 — recovering from a historic low of 25.6 reached on February 21, 2026, only the third time in Bitcoin’s history the RSI fell below 30. The MACD is forming a bullish cross on the 4H chart. The Fear & Greed Index stands at 15 — Extreme Fear — historically a contrarian accumulation signal.
Bitcoin Support and Resistance Levels — March 10, 2026
| Level | Price | What It Means |
| RESISTANCE 2 | $70,800 | Fibonacci cluster + EMA. Break above = bull case. Target $74,100. |
| RESISTANCE 1 | $68,800 | 100-day EMA. First ceiling to clear today. |
| IMMEDIATE RESIST | $67,600 | Bitcoin failed at this level on Sunday. First test today. |
| CURRENT PRICE | $67,579 | Trading just below immediate resistance at time of writing. |
| KEY SUPPORT | $65,600 | H&S neckline. 4H close below = bear case, target $59,500. |
| DEMAND ZONE | $62,300 | Weekly demand OB. 400K+ BTC accumulated here Feb–Mar 2026. |
| BEAR TARGET | $59,500 | H&S measured move. Only active if $65,600 breaks with volume. |
Why Is the Bitcoin Price Rising on March 10, 2026?
Three converging factors are driving today’s BTC price recovery:
1. Iran-US War De-escalation Signal. Trump hinted at a joint decision with Netanyahu. Any resolution reduces risk-off flows and directly benefits Bitcoin. CoinGape notes this is the first positive geopolitical signal since oil prices surged 18% YTD on the conflict.
2. Institutional Inflows Resuming. March 2026 has seen $155M in institutional inflows according to CoinGape data. Bitcoin ETFs crossed $1B in monthly inflows. Large wallet holders (1,000–1,000,000 BTC) showed no significant balance changes since March 5, 2026 — whales are accumulating, not distributing.
3. On-Chain Selling Pressure Gone. Glassnode data shows long-term holder selling collapsed 87% — from -243,737 BTC/month (February 5 peak) to -31,967 BTC (March 1). Miner net selling dropped from 4,718 BTC/day to 837 BTC/day. Supply pressure has largely ended.
Bitcoin Price Prediction March 10, 2026: Bull, Base and Bear
| Scenario | Price Target | Probability | Condition |
| BULL | $74,100–$78,000 | 25% | 4H close above $70,800 with volume. Iran deal confirmed. ETF inflows 3+ consecutive days. |
| BASE | $68,000–$70,800 | 50% | $65,600 holds. Slow grind to $70,800 resistance. Consolidation continues through mid-March. |
| BEAR | $59,500 | 25% | 4H close below $65,600 neckline with volume. H&S pattern confirmed. Risk-off macro returns. |
Two Trade Setups for March 10, 2026
| Setup | Entry | Stop Loss | Target 1 | Target 2 | R:R |
| LONG (best R:R) | $65,600–$66,000 | $64,800 | $68,800 (100 EMA) | $70,800 (Fib) | 1:4.6 |
| SHORT (if H&S confirms) | $67,600–$67,800 | $68,300 | $65,600 (neckline) | $62,300 (demand) | 1:7.0 |
Trigger for long: Bullish 4H candle close above $66,200 on above-average volume. Trigger for short: Bearish wick with declining volume at $67,600. Invalidation for both: Daily close outside the $64,800–$68,300 range.
Key Events Affecting Bitcoin Price This Week
| Date | Event | Expected Impact on BTC |
| Mar 10 (today) | Iran-US war update (Trump/Netanyahu) | Bullish on progress; bearish on collapse |
| Mar 11 | US CPI February 2026 | Cool = bullish; Hot = hawkish Fed, bearish for BTC |
| Mar 12 | Bitcoin ETF weekly flow data | 3 consecutive positive days = strongest near-term bull signal |
| Mar 14 | Weekly BTC close | Above $70,800 = bullish structure; Below $65,600 = bear alert |
| Mar 17–18 | FOMC Meeting — rate decision | Rate hold expected; any dovish signal = bullish for crypto |
Bottom line: The bitcoin price today is at a make-or-break zone. The smart play is to wait — long from $65,600–$66,000 on rejection, or long from $69,000 on a confirmed $68,800 breakout. Chasing $67,579 without confirmation is the wrong trade given the active H&S pattern overhead.
FAQ
What is the Bitcoin price prediction for March 10, 2026?
The Bitcoin price prediction for March 10, 2026 is $65,600–$70,800 base case range. Bitcoin is currently at $67,579 (up 1.05%, as of 08:00 UTC). The bull case target is $74,100 on a break above $70,800. The bear case is $59,500 if the $65,600 head-and-shoulders neckline breaks on a 4H close. The primary catalyst today is Trump’s Iran war de-escalation hint, which triggered a 53% volume surge to $37.89B.
What is the Bitcoin price today on March 10, 2026?
The Bitcoin price today on March 10, 2026 is $67,579 as of 08:00 UTC, according to CoinGecko. That is up 1.05% in the last 24 hours. The 24-hour trading range is $65,600 to $68,200. Bitcoin’s market cap is $1.34 trillion with a 24-hour volume of $37.89 billion. The Fear and Greed Index stands at 15, signalling Extreme Fear.
What is the Bitcoin support level on March 10, 2026?
The critical Bitcoin support level on March 10, 2026 is $65,600 — the neckline of a head-and-shoulders pattern on the 4H chart. A confirmed 4H close below $65,600 with volume would activate a measured move target of $59,500. The next support below that is the $62,300 weekly demand zone, where more than 400,000 BTC were accumulated during February and March 2026, according to Glassnode on-chain data.
What is the Bitcoin resistance level on March 10, 2026?
Bitcoin faces immediate resistance at $67,600 — a level it failed to hold on March 9. Above that, $68,800 is the 100-day EMA. The key resistance for bitcoin in March 2026 is $70,800, which represents a Fibonacci cluster and moving average convergence. A confirmed 4H close above $70,800 with volume would target $74,100 and activate the bull case scenario.
Will Bitcoin go up or down on March 10, 2026?
Based on available technical and macro data as of March 10, 2026: the base case (50% probability) is sideways consolidation between $65,600 and $70,800. The bull case (25% probability) points to $74,100 if $70,800 resistance breaks. The bear case (25% probability) points to $59,500 if the $65,600 neckline breaks. The Iran war de-escalation signal from Trump is the primary short-term bullish catalyst, while the active head-and-shoulders pattern on the 4H chart is the primary bearish risk.
Why is Bitcoin price up today March 10, 2026?
Bitcoin price is up 1.05% today — March 10, 2026 — primarily because US President Trump hinted at a joint decision with Israeli PM Netanyahu on a potential US-Iran war resolution. Geopolitical de-escalation reduces risk-off flows and boosts risk assets including crypto. Supporting factors include $155M in institutional inflows in March 2026, Bitcoin ETFs crossing $1B in monthly inflows, and Glassnode data showing long-term holder selling has collapsed 87% from its February 5 peak.
What does the head-and-shoulders pattern mean for Bitcoin in March 2026?
The head-and-shoulders pattern on Bitcoin’s 4H chart as of March 10, 2026 has its neckline at $65,600. If Bitcoin closes a 4H candle below $65,600 with above-average volume, the pattern technically targets $59,500 — approximately 12% below current price. However, Bitcoin briefly broke below $65,600 on March 8 and reclaimed it, which weakens the pattern’s immediate bearish signal. The pattern is invalidated if Bitcoin closes above $70,800 with volume.
What is the Bitcoin price prediction for the rest of March 2026?
For the rest of March 2026, the Bitcoin price prediction base case is a gradual recovery toward $70,800–$74,100 if geopolitical tensions ease and US CPI data (March 11) comes in cooler than expected. The FOMC meeting on March 17–18 is a key macro event — any dovish Fed signal would be bullish for BTC. The bear case for late March 2026 is a retest of $62,300 demand zone if the head-and-shoulders pattern at $65,600 completes. Analysts including Henrik Zeberg maintain a $110,000–$120,000 target for Bitcoin in 2026 if the macro environment improves in Q2.